
Heatwaves, recognised as one of the key natural hazard risks to human health, have increased in frequency and intensity in recent decades, a trend projected to continue under most future climate scenarios (e.g. Perkins-Kirkpatrick et al., 2016).
This, in combination with Australia’s population growth, greater urbanisation and an aging population – with the elderly more likely to experience poor health and to be living alone with fewer social contacts and limited finances – places an increased importance on research-based risk reduction strategies.
Risk Frontiers (RF) recently published a paper analysing statistics of fatalities associated with extreme heat in Australia from 2001 to 2018, as identified by a Coroner. This work expands on previous RF work on Australian heatwave fatalities from 1844 to 2010 (Coates et al., 2014), which determined that heatwaves were second only to disease epidemics in lives lost from natural hazards.
Method
This study employed one of the most widely used measurements of heatwave definition: the Excess Heat Factor (EHF), the basis for the Bureau of Meteorology heatwave warning system (Nairn and Fawcett, 2015). The EHF index identifies conditions significantly hotter than usual for a given location-– details of the methodology and definitions used are in Coates et al. (2021) but, in short:
- Heat-related fatalities were defined as deaths determined by a coroner to be related in some way to the effects of heat: e.g. cardiac arrest that was exacerbated by heat and
- Heatwave fatalities were defined as any heat-related fatality which occurred during a heatwave as defined by the EHF index. Heatwave severity was classified according to the Nairn and Fawcett (2015) scheme.
Heat-related deaths are generally not well documented: heat often contributes to death without being the direct cause and may not be considered as a potential cause of death. With respect to coronial records, it is generally not possible to identify heat-related deaths through autopsy alone: the circumstances around the death must also be understood. Thus, many deaths that are in fact heat-related will not necessarily be recorded as such.
Our research was based on closed case1 records from 1 July 2000 to 30 June 2018 (i.e. financial years FY2001–FY2018) from the National Coronial Information System (NCIS) database. NCIS maintains a secure online database storing deaths reported to a coroner from all Australian jurisdictions from July 2000 (Queensland from January 2001) and New Zealand from July 2007. Due to the sensitive nature of the data, ethics approvals were obtained from the human research ethics committees of Australia’s jurisdictions.
Raw numbers of fatalities were normalised by viewing the fatality numbers against a background population of the particular group of interest – for example, the population of males versus females; Queensland versus Victoria; FY2003 versus FY2015. Normalisation enables the comparison of fatalities over time and across jurisdictions by accounting for any increases in population over time and differences in population numbers from one location to another. This is termed the fatality rate.
Limitations other than those mentioned included a relatively large proportion of coronial cases in the more recent years of record unavailable for viewing, and the fact that data within coronial files was sometimes limited due to data recording differences over time and between jurisdictions: thus, the numbers presented here may be underestimated.
Results
At least 473 heat-related deaths were reported to Australian coroners in the 18 years from July 2000 to June 2018; 354 occurred during specified heatwave conditions and, of these, 244 occurred within or near buildings. There was no overall trend in fatality numbers or fatality rates, but a record of generally low numbers interspersed with a few very high numbers. Unless otherwise indicated, statistics below refer to the 354 specified heatwave fatalities.
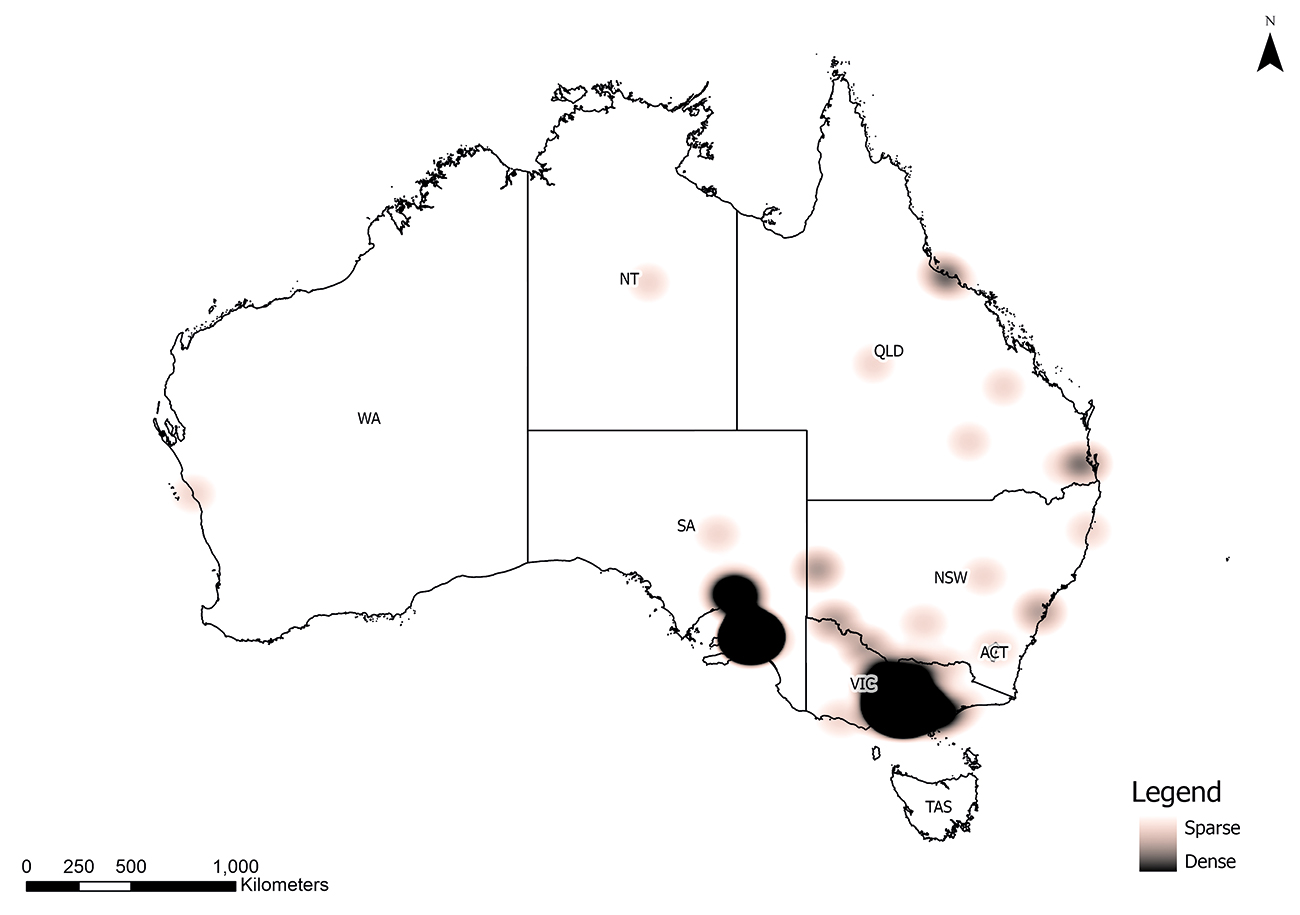
Heatwave fatality locations are shown in Figure 1. The highest density of fatalities occurred mainly in the coastal capitals, especially in south-eastern Australia.
Half of the heatwave fatalities occurred in Victoria (VIC) and a quarter in South Australia (SA). Just two heatwave events – in 2009 and 2014, across VIC and SA – accounted for 63% of all fatalities and 82% of building-related fatalities. The Northern Territory (NT) and SA had the highest fatality rates – 0.32 and 0.31 deaths per 100,000 population respectively – followed by VIC (0.18). All other jurisdictions were below the national average of 0.09.
Data available on cooling sources were limited. No type of air conditioning was present in most of the 50% of cases for which air conditioner ownership was known. In 4% of cases, air conditioning was known to be present and functional but not in use. In at least seven of these cases, it was reported the deceased had a habit of not using air conditioning.
Some 63% of fatalities were male, although this varied: e.g. 55% in FY2009 but 63% in FY2014 – the two extreme heatwave years. Figure 2 shows the number of male and female fatality numbers and fatality rates, peaking in FY2009 and FY2014.

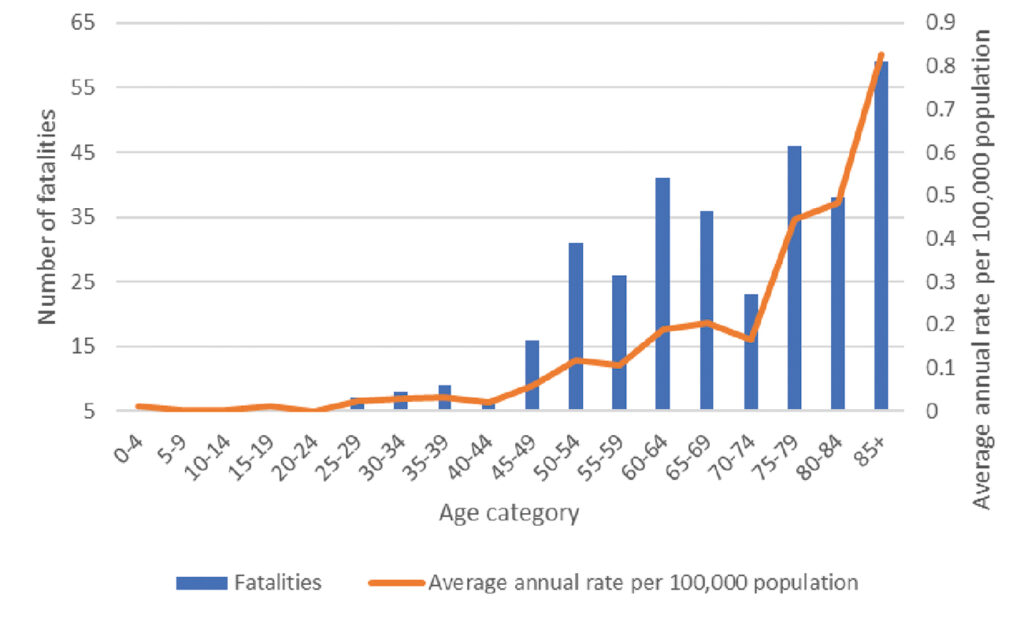
In general, most deaths occurred in those aged 50 years and above (Figure 3); notably in the 85+ and 75–79-year age groups. Some 243 (69% of) fatalities occurred in those aged 60 years and above; of the 244 fatalities that occurred indoors, 80% occurred in this group.
The vulnerability of older Australians to heatwaves is further shown in Figure 3 by the fatality rate, which increased slightly for the 50–54 and 55–59 age groups, again for the 60–64 to 70–74 age groups, and more sharply for the 75–79, 80–84 and 85-plus age groups.
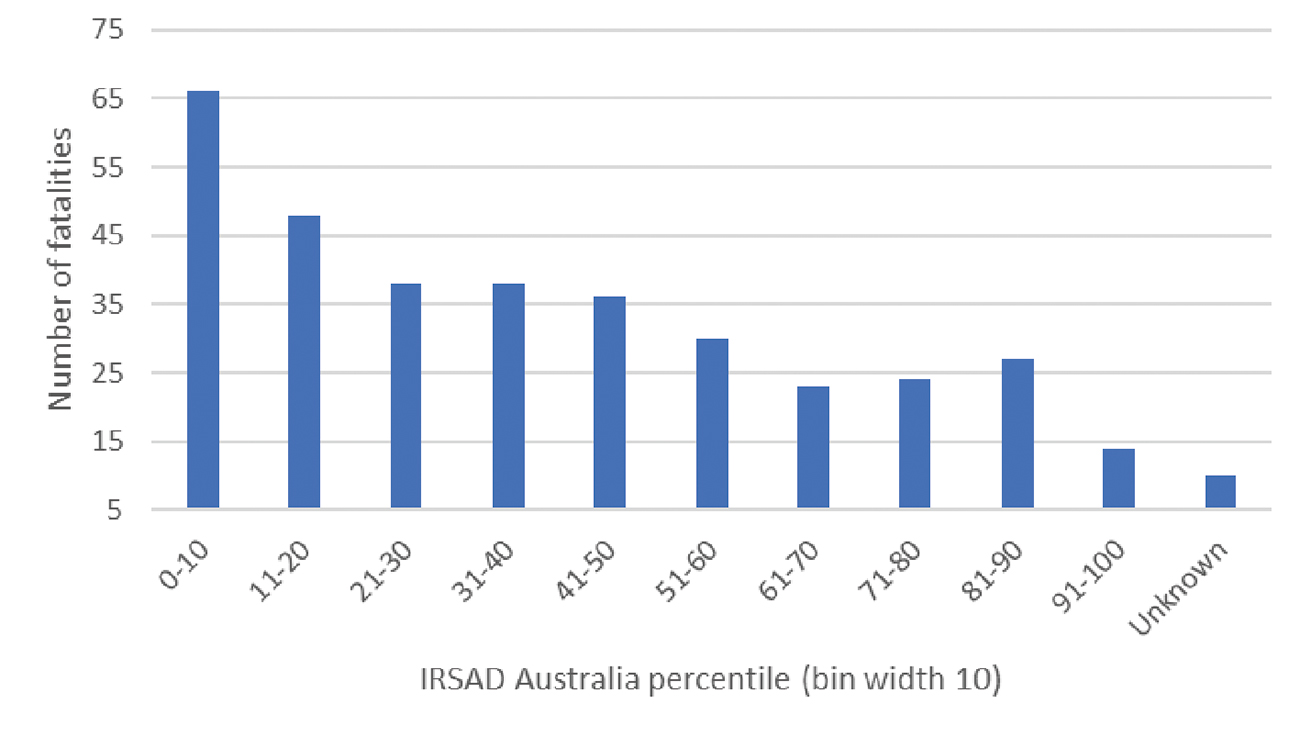
A low SEIFA/ IRSAD index score2 indicates lack of socio-economic advantage and relatively greater disadvantage, and a high score indicates greater advantage and a relative lack of disadvantage. Use of this index clearly showed that more deaths occurred amongst those locations showing the greatest socio-economic disadvantage and least advantage. Some 64% of fatalities occurred in the top 50% most socio-economically disadvantaged areas and 32% in the top 20% most socio-economically disadvantaged areas (Figure 4).
Most commonly, decedents were carrying out ‘business as usual’ (48%), with no precautions taken in at least 38 cases and some precautions taken in at least 18 cases. The next most common behaviours were no/limited action (11%) and attempting to cool themselves without leaving the building (11%). Other behaviours which may have contributed to heat-related deaths included lack of air circulation, strenuous activity in the heat, living in squalor, refusing assistance and/or medications or not using home air conditioning.
Discussion
We found that heatwaves still pose a greater threat to Australian lives than any other natural hazard. Australia has no national heatwave risk management framework, although groundwork has been laid by many of Australia’s jurisdictions. Heatwaves are a complex hazard: thus, an integrated, concerted management approach, consisting of risk assessment, care for vulnerable people, urban planning, landscape management, emergency and recovery planning, community awareness and resilience and organisation and business resilience, is necessary.
Our results agree with other Australian and international studies: those more likely to die in heatwave events are the elderly, young children, people with existing medical conditions and/or disabilities, the isolated, and people who experience social and financial disadvantage. An added difficulty is that those most vulnerable to heatwaves are generally also vulnerable to other risks in society and are often overlooked or difficult to access.
Our results emphasise the importance of retrofitting existing housing stock to better cater for the greater proportion of the elderly who use them as refuge. The implementation of targeted awareness campaigns with a particular focus on those who are older and/or socially or geographically isolated, socio-economically disadvantaged or living with a disability – as a partnership between local councils, public health authorities, general practitioners, pharmacies, community organisations and public/social housing providers – could improve these conditions.
For more information, go to riskfrontiers.com
Notes
1. Closed cases are those finalised (i.e., investigations are no longer open) and thus available for viewing.
2. The Socio-Economic Indexes for Areas (SEIFA) data product, derived from the ABS five-yearly Census of Population and Housing, enables the assessment of the relative welfare of Australian communities. The Index of Relative Socio-economic Advantage and Disadvantage (IRSAD), created from 2016 census data to summarise socio-economic conditions within defined areas, is used when the topic being analysed is likely to be affected by both advantage and disadvantage.
About the Author
Lucinda is a Senior Research Consultant specialising in risk reduction and climate change adaptation assessment, natural hazard fatalities trends, vulnerability versus resilience, and evaluations of risk perception and risk communication. She has a Master of Geoscience from Macquarie University.