

Queensland is no stranger to heat and heatwaves – from Southeast Queensland to western Queensland and the Outback to the Far North. Queenslanders know it gets hot, but there is a distinction between being hot (seasonal heat) and a heatwave which is determined by local thresholds.The average annual heatwave frequency in Queensland has increased steadily over the last 60 years as shown in Figure 1. It is clear heatwaves are increasing in frequency, duration and intensity and are affecting more and more of Queensland. Disturbingly, heatwaves are already responsible for more deaths and significant burden on the health system in Australia than any other hazard.1
The projections of heatwave frequency are equally disturbing with accelerating increases in frequency expected from 2050 through to 2090. For example, the frequency of heatwaves is projected to increase by approximately 45% from now through to 2090 for Eastern Gulf of Carpentaria, and approximately 30% for the City of Gold Coast. To further exacerbate the situation, the duration of these heatwave is also set to significantly increase, along with an increase in temperature, and more and more nights over 20°C.2
How is a heatwave defined? The Bureau of Meteorology (the Bureau) uses the Excess Heat Factor (EHF) to identify and measure the severity of heatwaves. The EHF takes the prevailing environmental conditions into account and thus measures the ‘variation from normal’ as a measure of environmental stress.
The Bureau issues the heatwave service3 which shows regions of Extreme, Severe and Low-Intensity Heatwaves and where there is no heatwave.
The Bureau defines
- low intensity heatwaves as those with EHF values less than 1 – here it is expected that most will be able to cope,
- severe as EHF greater than 1 and less than 3 – here it is expected that vulnerable populations are challenged, and
- extreme as EHF greater than 3 – here everyone is at risk and infrastructure may be impacted.
Note, humidity is not considered in the determination of the EHF and heatwave severity.

Genesis of the Heatwave Impact Forecasting Project
Various activities have been underway across Australia to reduce the risk with heatwaves. Relevant activities include the
- Heatwave Service, initially issued by the Bureau in 2014, subsequently updated in 2022
- Sector Adaptation Plans to support the 2017 Queensland Climate Adaptation Strategy
- The Queensland State Heatwave Risk Assessment (SHRA) to provide impact and risk information across many sectors.
- QHealth revised the Heatwave Management Sub-Plan in 2019 following the publication of the SHRA. The sub-plan was first aligned with the EHF in 2015 and was the first jurisdiction to do so.
- The report ‘Reducing Illness and Lives from Heatwaves’ signalled the need for a service to make informed decisions on where, when and who will be impacted to reduce the risk from heatwaves.
These activities set the background to this project – to develop a service that aims to provide tangible and usable information on where, when and who will be impacted from heatwaves. The project is a collaboration between QFES, QHealth, DES, the Bureau, Australian Bureau of Statistics and Geoscience Australia based on specific leadership on heatwaves, hazard mapping, climate policy and data, warning products, social and economic data and existing impact forecasting capabilities.
The approach
The approach to calculate impact follows the accepted risk methodology of combining Hazard, Exposure and Vulnerability to give an impact index.
The Hazard in this instance is based upon the heatwave severity forecast issued by the Bureau. Exposure and Vulnerability are based upon a variety of health and socioeconomic measures.
Impact, whilst currently being calculated as an index, is still being evaluated against actual health impacts.
The Bureau currently publishes hazard data in two formats. The most visible is the seven-day heatwave severity forecast spatial service – most users will be familiar with it through Met-Eye, or in mobile applications.
The second, and the one used here, is the raw gridded data. This data contains a continuous spectrum of heatwave severity values in contrast to the generalised service provided as broad polygons and has a spatial resolution of about 5km.
When calculating Exposure and Vulnerability, three principal factors are considered. The first is the availability of amenities which could reduce the exposure. For example, swimming pools, places of cool refuge, proximity to hospitals are mitigating factors. An increase in the number of aged care facilities, meanwhile, is an extenuating factor.
The next consideration is intrinsic vulnerability, indicating the presence of a population that is predisposed to heatwave health impacts. These are considered on an individual and household basis. Examples at the household level include the presence of young and old, people requiring care, those suffering from chronic disease, indigenous and Torres Strait Islander populations, and those that work outside. Individual factors may include those who live alone and those who do not have access to the internet (communications service).
The final consideration is the capacity to respond. These are again considered at an individual and household level. Employment, English language proficiency, access to vehicles, requirements for assistance and SEIFA levels are considered.
These elements are combined to create a community profile which describes at a more granular level the communities’ resilience to heatwave. The expectation is that areas with lower resilience are accompanied by higher demand for health services, though this has not yet been tested.
The impact index is expressed as
Impact = Hazard x Exposure x Vulnerability
It is important to recognise that this impact index is not a quantitative measure of heatwave impact. The impact values should not be interpreted as the amount or extent of impact expected; rather, these values provide insight into which locations may experience greater impacts than others, and therefore provide value intelligence for decision makers.
Implementation
At approximately 13:30 each day the Bureau releases their heatwave forecast on the Australian Digital Forecast Database, and QFES downloads the heatwave severity forecast grids.
Next, a Python script combines the pre-calculated vulnerability and exposure grids with the daily heatwave severity forecast to produce a grid containing the impact forecast. The gridded impact forecast is based upon the same timestep intervals as the heatwave severity grid, meaning that the output grid has a seven-day forecast time scale. The gridded impact forecast is produced as a GeoTiff, which can be readily published to most web-based spatial systems, including ArcGIS, and be stored for future analytical use. This GeoTiff is saved to the QFES ArcGIS Image Service, enabled for live data, thereby ensuring that users have access to the most recent forecast.
Additionally, SA2 regional aggregations of heatwave impact index is saved as a CSV table, which is also instantly updated when the forecast is updated. This permits QFES to publish a simplified, aggregated view of the data over the entire state, which can be consumed within other disaster and emergency management stakeholders’ spatial systems.
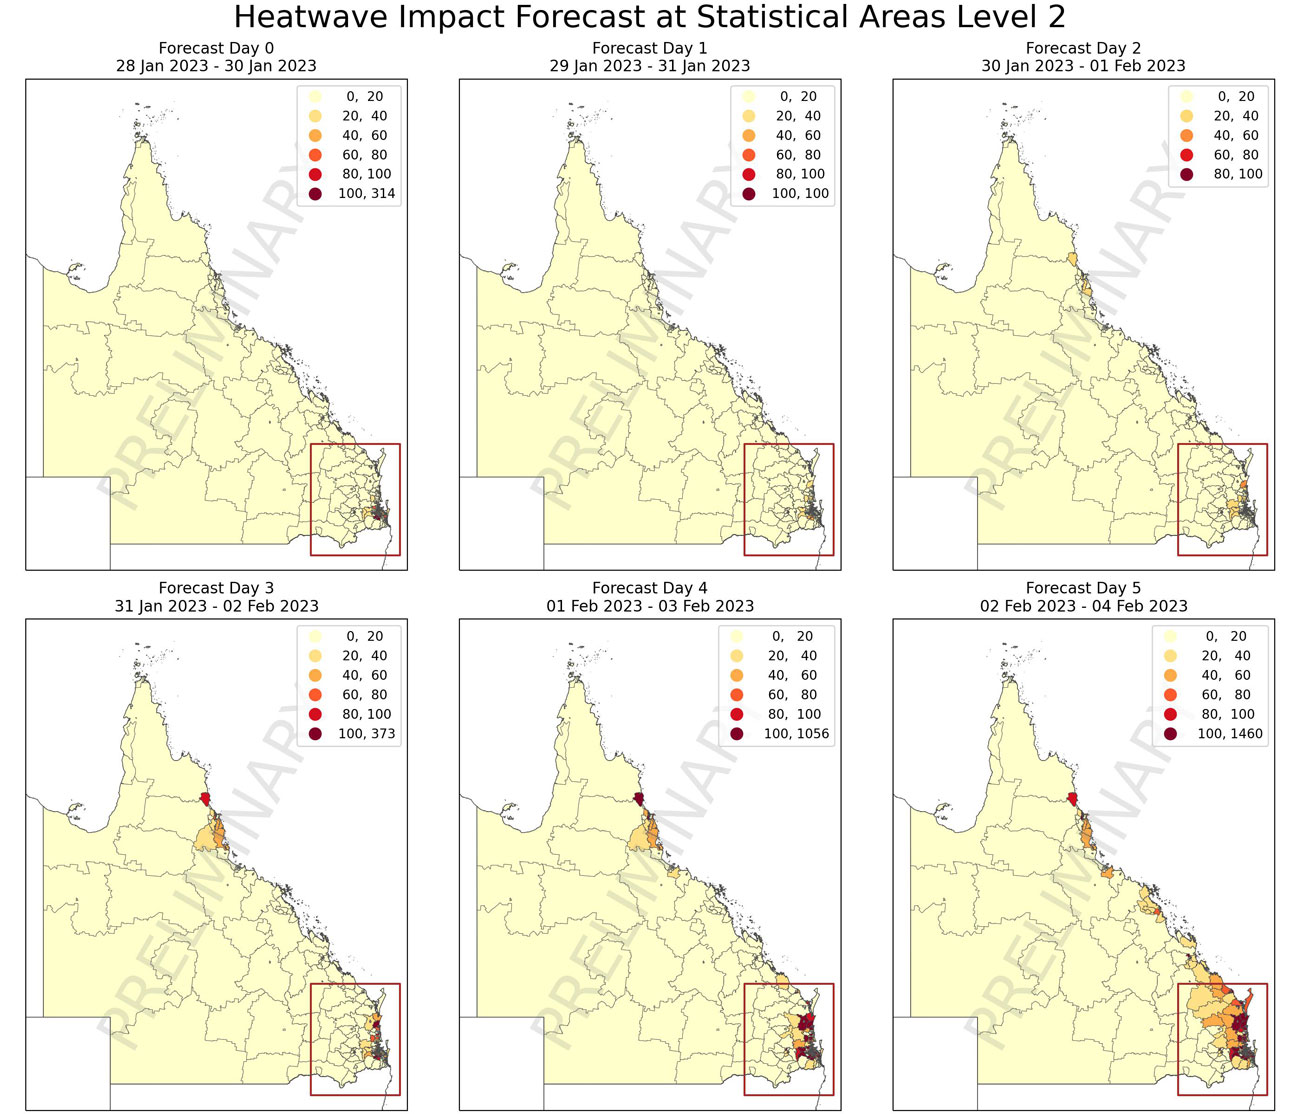
The prototype methodology was in place during the February 2023 heatwave event, and Figure 3 shows that coastal areas were adversely impacted, with a pronounced effect in Southeast QLD (SEQ).
At this stage it is worth reiterating that this is a trial which is actively underway, with a pilot in place.

Next steps
Further testing and validation are underway to determine if the proposed methodology demonstrates correlations between previous heatwave events and health occurrences data such as mortality, morbidity, ambulance requests and emergency room admissions. This back-testing is important to validate the methodology as without it, it is difficult to discern whether the methodology can usefully inform health service planning (including ambulance). This testing is being conducted in collaboration with James Cook University who have published widely on health impacts due to heatwaves in Queensland.
There is a further caveat where the current methodology for calculating EHF may not be the most appropriate for humid climate zones, particularly those north of the Tropic of Capricorn. This is because humidity plays an important role in human felt heat stress.
Acknowledgements
This project is funded by the Department of Environment and Science.
This article is based on a presentation at the AFAC 2023 conference held in Brisbane.
References
1. 2019 Queensland State Heatwave Risk Assessment
2. 2019 Queensland State Heatwave Risk Assessment
3. http://www.bom.gov.au/australia/heatwave/
4. http://www.bom.gov.au/australia/heatwave/knowledge-centre/heatwave-service.shtml
About the Author

Jane Sexton
Jane Sexton is Executive Manager, Hazard and Risk Unit at QFES. Jane joined QFES in 2022 after 16 years leading the development of national hazard and risk products and translating for local application in collaboration with state emergency services.

Simon Webster
Simon Webster is Executive Manager, Advanced Capability Support Unit (ACSU) at QFES. Simon holds executive positions at national and state level for spatial information and data standards, including the current national Chair of the Emergency Management Spatial Information Network Australia.

Kenneth Wong
Kenneth Wong is Principal Systems Officer (Data), ACSU at QFES. Kenneth has over 10 years of experience in regional climate models and decision support systems, and since joining QFES in 2021 has been involved in the development of disaster risk assessment and modelling products.

Nicole Mandalios
Nicole Mandalios is Manager, Disaster Management Branch at QHealth. Nicole is a public policy practitioner specialising in disaster management and is the heat management portfolio lead for Queensland Health, working with government and academic partners.
